Pack
MATH225N Statistical Reasoning For The Health Sciences ENTIRE COURSEWORK BUNDLE OFFER!!
Everything you need to know about MATH225N Statistical Reasoning For The Health Sciences
[Montrer plus]Everything you need to know about MATH225N Statistical Reasoning For The Health Sciences
[Montrer plus]
Question: A television station plans to send a crew to a polling center on an election day. Because they do not have time to interview each individual voter, they decide to count voters leaving the polling location and ask every 20th voter for an interview. What type of sampling is this? Question: I...
Aperçu 2 sur 7 pages
Ajouter au panierQuestion: A television station plans to send a crew to a polling center on an election day. Because they do not have time to interview each individual voter, they decide to count voters leaving the polling location and ask every 20th voter for an interview. What type of sampling is this? Question: I...
(MATH 225N Week 1 Assignment Variables) Question: Which of the following best describes the term explanatory variable? Question: Which of the following best describes the term qualitative? Question: A zoologist measures the birthweight of each cub in a litter of lions. What is the level of measureme...
Aperçu 2 sur 8 pages
Ajouter au panier(MATH 225N Week 1 Assignment Variables) Question: Which of the following best describes the term explanatory variable? Question: Which of the following best describes the term qualitative? Question: A zoologist measures the birthweight of each cub in a litter of lions. What is the level of measureme...

(MATH 225N Week 1 Assignment Sampling Methods) Question: Assume that 80houses are present in the form of a grid consisting of 10 columns and 8 If a loud speaker is placed just before the first row, which sampling method works the best to select a sample of houses if we want to get an estimate of the...
Aperçu 2 sur 10 pages
Ajouter au panier(MATH 225N Week 1 Assignment Sampling Methods) Question: Assume that 80houses are present in the form of a grid consisting of 10 columns and 8 If a loud speaker is placed just before the first row, which sampling method works the best to select a sample of houses if we want to get an estimate of the...

Question: A study is … to research the effects of drinking coffee on hours of sleep. Would an experimental or observational study design … more appropriate? Question: A researcher is … in the effects of watching videos just before bed on the quality of sleep. Which of the following claims woul...
Aperçu 2 sur 13 pages
Ajouter au panierQuestion: A study is … to research the effects of drinking coffee on hours of sleep. Would an experimental or observational study design … more appropriate? Question: A researcher is … in the effects of watching videos just before bed on the quality of sleep. Which of the following claims woul...

Present two different types of data, or variables, used in the health field. Examples could be blood pressure, temperature, pH, pain rating scales, pulse oximetry, % hematocrit, minute respiration, gender, age, ethnicity, etc. Classify each of your variables as qualitative or quantitative and explai...
Aperçu 1 sur 2 pages
Ajouter au panierPresent two different types of data, or variables, used in the health field. Examples could be blood pressure, temperature, pH, pain rating scales, pulse oximetry, % hematocrit, minute respiration, gender, age, ethnicity, etc. Classify each of your variables as qualitative or quantitative and explai...

Question: A company has developed a wristband for monitoring blood sugar levels without requiring direct blood samples. It is interested in demonstrating the accuracy of the device for governmental approval and has decided to test the claim “The glucose level reported by the wristband is within 10...
Aperçu 2 sur 15 pages
Ajouter au panierQuestion: A company has developed a wristband for monitoring blood sugar levels without requiring direct blood samples. It is interested in demonstrating the accuracy of the device for governmental approval and has decided to test the claim “The glucose level reported by the wristband is within 10...

Question: A data set is … in the frequency table below. Using the table, determine the number of values less than or equal to 5. Give your answer as a single number. For example if you found the number of values was 19, you would enter 19. Question: Given the frequency table, how many times does t...
Aperçu 3 sur 20 pages
Ajouter au panierQuestion: A data set is … in the frequency table below. Using the table, determine the number of values less than or equal to 5. Give your answer as a single number. For example if you found the number of values was 19, you would enter 19. Question: Given the frequency table, how many times does t...

Question: Given the following box-and-whisker plot, decide if the data is skewed or symmetrical.……… Select the correct answer below: Question: Which of the following frequency tables show a skewed data set? Select all answers that apply.……… Select the correct answer below: Question: Whic...
Aperçu 3 sur 27 pages
Ajouter au panierQuestion: Given the following box-and-whisker plot, decide if the data is skewed or symmetrical.……… Select the correct answer below: Question: Which of the following frequency tables show a skewed data set? Select all answers that apply.……… Select the correct answer below: Question: Whic...

Question: If the median of a data set is 13and the mean is 13, which of the following is most likely? Question: Which of the following box-and-whisker plots shows a skewed data set? Select all answers that apply. A horizontal box-and-whisker plot is above a horizontal axis labeled from 0 to 16 in in...
Aperçu 2 sur 10 pages
Ajouter au panierQuestion: If the median of a data set is 13and the mean is 13, which of the following is most likely? Question: Which of the following box-and-whisker plots shows a skewed data set? Select all answers that apply. A horizontal box-and-whisker plot is above a horizontal axis labeled from 0 to 16 in in...

(MATH 225N Week 4 Statistics Quiz) Question: Alice sells boxes of candy at the baseball game and wants to know the mean number of boxes she sells. The numbers for the games so far are ……. 16,14,14,21,15 Question: Given the following list of prices (in thousands of dollars) of randomly selected t...
Aperçu 2 sur 12 pages
Ajouter au panier(MATH 225N Week 4 Statistics Quiz) Question: Alice sells boxes of candy at the baseball game and wants to know the mean number of boxes she sells. The numbers for the games so far are ……. 16,14,14,21,15 Question: Given the following list of prices (in thousands of dollars) of randomly selected t...

MATH 225N Week 4 Statistics Quiz With Further Additional Questions
Aperçu 3 sur 20 pages
Ajouter au panierMATH 225N Week 4 Statistics Quiz With Further Additional Questions

(MATH 225N Week 4 Quiz) 1. Question: Brayden tosses a coin 500 Of those 500times, he observes heads a total of 416 times. Calculations show that the probability of this occurring by chance is less than 0.01, assuming the coin is fair. Determine the meaning of the significance level. 2. Question: Su...
Aperçu 3 sur 25 pages
Ajouter au panier(MATH 225N Week 4 Quiz) 1. Question: Brayden tosses a coin 500 Of those 500times, he observes heads a total of 416 times. Calculations show that the probability of this occurring by chance is less than 0.01, assuming the coin is fair. Determine the meaning of the significance level. 2. Question: Su...

(MATH 225N Week 4 Quiz) 1. Question: Brayden tosses a coin 500 Of those 500times, he observes heads a total of 416 times. Calculations show that the probability of this occurring by chance is less than 0.01, assuming the coin is fair. Determine the meaning of the significance level. 2. Question: Su...
Aperçu 2 sur 12 pages
Ajouter au panier(MATH 225N Week 4 Quiz) 1. Question: Brayden tosses a coin 500 Of those 500times, he observes heads a total of 416 times. Calculations show that the probability of this occurring by chance is less than 0.01, assuming the coin is fair. Determine the meaning of the significance level. 2. Question: Su...

(MATH 225N Week 4 Homework) Question: Which of the pairs of events below is dependent? Select the correct answer below: Question: Identify the option below that represents dependent events. Select the correct answer below: Question: … shows mutually exclusive events? Select the correct answer belo...
Aperçu 3 sur 28 pages
Ajouter au panier(MATH 225N Week 4 Homework) Question: Which of the pairs of events below is dependent? Select the correct answer below: Question: Identify the option below that represents dependent events. Select the correct answer below: Question: … shows mutually exclusive events? Select the correct answer belo...

1x vendu
Question: On a busy Sunday morning, a waitress randomly sampled customers about their preference for morning beverages, Specifically, she wanted to find out how many people preferred coffee over tea. The proportion of customers that … coffee was 0.42 with a margin of error 0.07…….. Construct a...
Aperçu 3 sur 20 pages
Ajouter au panierQuestion: On a busy Sunday morning, a waitress randomly sampled customers about their preference for morning beverages, Specifically, she wanted to find out how many people preferred coffee over tea. The proportion of customers that … coffee was 0.42 with a margin of error 0.07…….. Construct a...

Question: A statistics professor recently graded final exams for students in her introductory statistics course. In a review of her grading, she … the mean score out of 100points was a x¯=77, with a margin of error of 10……Construct a confidence interval for the mean score (out of 100 points) ...
Aperçu 2 sur 11 pages
Ajouter au panierQuestion: A statistics professor recently graded final exams for students in her introductory statistics course. In a review of her grading, she … the mean score out of 100points was a x¯=77, with a margin of error of 10……Construct a confidence interval for the mean score (out of 100 points) ...

1. Question: .Jamie, a bowler, claims that her bowling score is less than 168 points, on average. Several of her teammates do not believe her, so she decides to do a hypothesis test, at a 1% significance level, to persuade them. She bowls 17 The mean score of the sample games is 155 points. Jamie kn...
Aperçu 2 sur 8 pages
Ajouter au panier1. Question: .Jamie, a bowler, claims that her bowling score is less than 168 points, on average. Several of her teammates do not believe her, so she decides to do a hypothesis test, at a 1% significance level, to persuade them. She bowls 17 The mean score of the sample games is 155 points. Jamie kn...

(Hypothesis Test) Question: A teacher claims that the proportion of students … to pass an exam is greater than 80%. To test this claim, the teacher administers the test to 200 random students and determines that 151 students pass the exam. Question: A hospital administrator claims that the propor...
Aperçu 2 sur 9 pages
Ajouter au panier(Hypothesis Test) Question: A teacher claims that the proportion of students … to pass an exam is greater than 80%. To test this claim, the teacher administers the test to 200 random students and determines that 151 students pass the exam. Question: A hospital administrator claims that the propor...

(MATH 225N Week 7 Hypothesis Testing) Question: Steve listens to his favorite streaming music service when he works out. He wonders whether the service algorithm does a good job of finding random songs that he will like more often than not. To test this, he listens to 50 songs chosen by the service...
Aperçu 4 sur 32 pages
Ajouter au panier(MATH 225N Week 7 Hypothesis Testing) Question: Steve listens to his favorite streaming music service when he works out. He wonders whether the service algorithm does a good job of finding random songs that he will like more often than not. To test this, he listens to 50 songs chosen by the service...

Question: True or False: The more samples taken in a scientific study, the longer the amount of time it will take to complete the research on the samples.Although there are other factors that affect study time, such as experience and equipment, increasing the number of samples will cause an increase...
Aperçu 2 sur 5 pages
Ajouter au panierQuestion: True or False: The more samples taken in a scientific study, the longer the amount of time it will take to complete the research on the samples.Although there are other factors that affect study time, such as experience and equipment, increasing the number of samples will cause an increase...

Question: A scientific study on gerbil population growth results in the data below…. The least squares regression line modeling this data is given by yˆ=13.3 5.567x. What is the slope of the regression line? Round your answer to three decimal places. Question: The scatter plot below shows data f...
Aperçu 2 sur 6 pages
Ajouter au panierQuestion: A scientific study on gerbil population growth results in the data below…. The least squares regression line modeling this data is given by yˆ=13.3 5.567x. What is the slope of the regression line? Round your answer to three decimal places. Question: The scatter plot below shows data f...

Question: The table below shows data on annual expenditure, x(in dollars), on recreation and annual income, y (in dollars), of 20 Use Excel to find the best fit linear regression equation. Round the slope and intercept to the nearest integer. Question: An economist is studying the link between the t...
Aperçu 2 sur 5 pages
Ajouter au panierQuestion: The table below shows data on annual expenditure, x(in dollars), on recreation and annual income, y (in dollars), of 20 Use Excel to find the best fit linear regression equation. Round the slope and intercept to the nearest integer. Question: An economist is studying the link between the t...

Question: An economist is studying the link between the total value of a country’s exports and that country’s gross domestic product, or GDP. The economist recorded the GDP and Export value (in millions of $’s) for 30 nations for the same fiscal year. This sample data is provided below. Quest...
Aperçu 2 sur 12 pages
Ajouter au panierQuestion: An economist is studying the link between the total value of a country’s exports and that country’s gross domestic product, or GDP. The economist recorded the GDP and Export value (in millions of $’s) for 30 nations for the same fiscal year. This sample data is provided below. Quest...

2x vendu
(MATH 225N Week 8 Assignment Performing Linear Regressions) Question: The table below shows data on annual expenditure, x(in dollars), on recreation and annual income, y (in dollars), of 20 Use Excel to find the best fit linear regression equation. Round the slope and intercept to the nearest intege...
Aperçu 3 sur 17 pages
Ajouter au panier(MATH 225N Week 8 Assignment Performing Linear Regressions) Question: The table below shows data on annual expenditure, x(in dollars), on recreation and annual income, y (in dollars), of 20 Use Excel to find the best fit linear regression equation. Round the slope and intercept to the nearest intege...

Question: A medical experiment on tumor growth gives the following data table……… The least squares regression line was … Using technology, it was … that the total sum of squares (SST) was 8and the sum of squares of regression (SSR) was 3789.0. Calculate R2, rounded to three decimal places....
Aperçu 1 sur 4 pages
Ajouter au panierQuestion: A medical experiment on tumor growth gives the following data table……… The least squares regression line was … Using technology, it was … that the total sum of squares (SST) was 8and the sum of squares of regression (SSR) was 3789.0. Calculate R2, rounded to three decimal places....

Question: The table shows data collected on the relationship between the time spent studying per day and the time spent reading per day. The line of best fit for the data is yˆ=0.16x 36.2. Assume the line of best fit is significant and there is a strong linear relationship between the variables…....
Aperçu 3 sur 25 pages
Ajouter au panierQuestion: The table shows data collected on the relationship between the time spent studying per day and the time spent reading per day. The line of best fit for the data is yˆ=0.16x 36.2. Assume the line of best fit is significant and there is a strong linear relationship between the variables…....

MATH 225N Week 8 Interpret the Slope & Y-Intercept of the Least Squares Regression Line (Q & A) Question: A scientific study on gerbil population growth results in the data below….. The least squares regression line modeling this data is given by yˆ=13.3 5.567x. What is the intercept of the regre...
Aperçu 3 sur 16 pages
Ajouter au panierMATH 225N Week 8 Interpret the Slope & Y-Intercept of the Least Squares Regression Line (Q & A) Question: A scientific study on gerbil population growth results in the data below….. The least squares regression line modeling this data is given by yˆ=13.3 5.567x. What is the intercept of the regre...

Question: Annie owns a tutoring service. For each tutoring session, she charges $75 plus $35 per hour of work. A linear equation that expresses the total amount of money Annie earns per tutoring session is y=75 35x. What are the independent and dependent variables? What is the y-intercept and the sl...
Aperçu 2 sur 8 pages
Ajouter au panierQuestion: Annie owns a tutoring service. For each tutoring session, she charges $75 plus $35 per hour of work. A linear equation that expresses the total amount of money Annie earns per tutoring session is y=75 35x. What are the independent and dependent variables? What is the y-intercept and the sl...

Question: A fitness center claims that the mean amount of time that a person spends at the gym per visit is 33 Identify the null hypothesis, H0, and the alternative hypothesis, Ha, in terms of the parameter μ. Question: The answer choices below represent different hypothesis tests. Which of the cho...
Aperçu 3 sur 18 pages
Ajouter au panierQuestion: A fitness center claims that the mean amount of time that a person spends at the gym per visit is 33 Identify the null hypothesis, H0, and the alternative hypothesis, Ha, in terms of the parameter μ. Question: The answer choices below represent different hypothesis tests. Which of the cho...

Question: A fitness center claims that the mean amount of time that a person spends at the gym per visit is 33 Identify the null hypothesis, H0, and the alternative hypothesis, Ha, in terms of the parameter μ. Question: The answer choices below represent different hypothesis tests. Which of the cho...
Aperçu 4 sur 74 pages
Ajouter au panierQuestion: A fitness center claims that the mean amount of time that a person spends at the gym per visit is 33 Identify the null hypothesis, H0, and the alternative hypothesis, Ha, in terms of the parameter μ. Question: The answer choices below represent different hypothesis tests. Which of the cho...

MATH 225N Week 8 Final Exam (Version 1) Question: A fitness center claims that the mean amount of time that a person spends at the gym per visit is 33 Identify the null hypothesis, H0, and the alternative hypothesis, Ha, in terms of the parameter μ. Question: The answer choices below represent diff...
Aperçu 4 sur 74 pages
Ajouter au panierMATH 225N Week 8 Final Exam (Version 1) Question: A fitness center claims that the mean amount of time that a person spends at the gym per visit is 33 Identify the null hypothesis, H0, and the alternative hypothesis, Ha, in terms of the parameter μ. Question: The answer choices below represent diff...
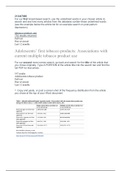
MATH 225N Week 3 Lab Assignment: Adolescents First Tobacco Products,Chamberlain For our first broad-based search, use the underlined words in your chosen article to search and see how many articles from the database contain these underlined words (see the example below the article list for an exampl...
Aperçu 1 sur 3 pages
Ajouter au panierMATH 225N Week 3 Lab Assignment: Adolescents First Tobacco Products,Chamberlain For our first broad-based search, use the underlined words in your chosen article to search and see how many articles from the database contain these underlined words (see the example below the article list for an exampl...

Les clients de Stuvia ont évalués plus de 700 000 résumés. C'est comme ça que vous savez que vous achetez les meilleurs documents.

Vous pouvez payer rapidement avec iDeal, carte de crédit ou Stuvia-crédit pour les résumés. Il n'y a pas d'adhésion nécessaire.

Vos camarades écrivent eux-mêmes les notes d’étude, c’est pourquoi les documents sont toujours fiables et à jour. Cela garantit que vous arrivez rapidement au coeur du matériel.
Vous obtenez un PDF, disponible immédiatement après votre achat. Le document acheté est accessible à tout moment, n'importe où et indéfiniment via votre profil.
Our satisfaction guarantee ensures that you always find a study document that suits you well. You fill out a form, and our customer service team takes care of the rest.
Stuvia est une place de marché. Alors, vous n'achetez donc pas ce document chez nous, mais auprès du vendeur vicbanks. Stuvia facilite les paiements au vendeur.
Non, vous n'achetez ce résumé que pour $48.49. Vous n'êtes lié à rien après votre achat.
4.6 étoiles sur Google & Trustpilot (+1000 avis)
91401 résumés ont été vendus ces 30 derniers jours
Fondée en 2010, la référence pour acheter des résumés depuis déjà 14 ans