Math 534 week 4 Study guides, Class notes & Summaries
Looking for the best study guides, study notes and summaries about Math 534 week 4? On this page you'll find 45 study documents about Math 534 week 4.
Page 3 out of 45 results
Sort by

-
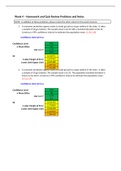
MATH 534 Week 4 Addendum Homework-Quiz Review Problems and Notes
- Other • 5 pages • 2023
- $17.99
- + learn more
1. Aconsumerprotectionagencywantstostudygaspricesatgasstationsinthestate.Ittakesasample of 50 gas stations.The sample mean is $2.35 with a standard deviation of $0.12.Constructa99%confidenceintervaltoestimatethepopulationmean.(2.30,2.40) 2. Aconsumerprotectionagencywantstostudygaspricesatgasstationsinthestate.Ittakesasample of 50 gas stations.The sample mean is $2.35. The population standard deviaiton isknown to be $0.10. Construct a 99% confidence interval to estimate the population mean.(2.31...

-
MATH 534 Week 4 Addendum; Homework-Quiz Review Problems and Notes
- Other • 5 pages • 2023
- $16.99
- + learn more
1. Question: A consumer protection agency wants to study gas prices at gas stations in the state. It takes a sample of 50 gas stations. The sample mean is $2.35 with a standard deviation of $0.12. Construct a 99% confidence interval to estimate the population mean. 2. Question: A consumer protection agency wants to study gas prices at gas stations in the state. It takes a sample of 50 gas stations. The sample mean is $2.35. The population standard deviation is known to be $0.10. Construct a 99%...
-
MATH 534 Week 4 Addendum; Homework-Quiz Review Problems and Notes
- Other • 5 pages • 2023
- $15.49
- + learn more
1. Question: A consumer protection agency wants to study gas prices at gas stations in the state. It takes a sample of 50 gas stations. The sample mean is $2.35 with a standard deviation of $0.12. Construct a 99% confidence interval to estimate the population mean. 2. Question: A consumer protection agency wants to study gas prices at gas stations in the state. It takes a sample of 50 gas stations. The sample mean is $2.35. The population standard deviation is known to be $0.10. Construct a 99%...

-
MATH 534 Week 4 Addendum; Homework-Quiz Review Problems and Notes
- Exam (elaborations) • 5 pages • 2023
- $25.48
- + learn more
1. Question: A random sample of 100 selected from a population with a standard deviation of 10 yielded a mean = 225. The mean and the standard deviation of the distribution of the sample means are __________. 2. Question: Suppose a random sample of 49 is selected from a population of size N = 500 with a standard deviation of 14. If the sample mean is 125, the 99% confidence interval to estimate the population mean is between ____________. 3. Question: A manufacturer wants to purchase a certain...

-
MATH 534 Week 4 Discussion Confidence Intervals in Business (Keller)
- Other • 3 pages • 2023
- $14.99
- + learn more
Confidenceintervalsrepresenttherangeofuncertaintyassociatedwiththeestimation of a statistic (mean, proportion, or standard deviation, etc.). There is always a risk ofsampling error associated with an estimate. Confidence intervals are useful forestablishing bounds for estimating, in particular, the mean or standard deviation, butalso regression coefficients, proportions, frequency rates, and differences betweenpopulations. Also, a 95% confidence interval indicates that for 19 out of 20 samplest...

Too much month left at the end of the money?


-
MATH 534 Week 4 Discussion; Confidence Intervals in Business (Keller)
- Other • 1 pages • 2023
- $15.49
- + learn more
Confidenceintervalsrepresenttherangeofuncertaintyassociatedwiththeestimation of a statistic (mean, proportion, or standard deviation, etc.). There is always a risk ofsampling error associated with an estimate. Confidence intervals are useful forestablishing bounds for estimating, in particular, the mean or standard deviation, butalso regression coefficients, proportions, frequency rates, and differences betweenpopulations. Also, a 95% confidence interval indicates that for 19 out of 20 samplest...

-
MATH 534 Week 4 Discussion; Confidence Intervals in Business (Keller)
- Other • 1 pages • 2023
- $18.48
- + learn more
Confidenceintervalsrepresenttherangeofuncertaintyassociatedwiththeestimation of a statistic (mean, proportion, or standard deviation, etc.). There is always a risk ofsampling error associated with an estimate. Confidence intervals are useful forestablishing bounds for estimating, in particular, the mean or standard deviation, butalso regression coefficients, proportions, frequency rates, and differences betweenpopulations. Also, a 95% confidence interval indicates that for 19 out of 20 samplest...

-
MATH 534 Applied Managerial Statistics (Updated 2023) Week 4 Addendum: Homework NEW GUARANTEED PASS
- Exam (elaborations) • 6 pages • 2023
- $14.00
- + learn more
MATH 534 Applied Managerial Statistics (Updated 2023) Week 4 Addendum: Homework NEW GUARANTEED PASS

-
MATH 534 APPLIED MANAGERIAL STATISTICS Week 7 Course Project Part C: Regression and Correlation Analysis.
- Exam (elaborations) • 10 pages • 2022
- $10.49
- + learn more
MATH 534 APPLIED MANAGERIAL STATISTICS Week 7 Course Project Part C: Regression and Correlation Analysis. COURSE PROJECT: PART C 2 1. Generate a scatterplot for the specified dependent variable (Y) and the X1 independent variable, including the graph of the "best fit" line. Interpret. Fitted Plot Line 0 20 40 60 80 100 120 140 0 10 20 30 40 50 60 According to the Graph the linear relationship there is a positive relationship between Sales and calls. If number of calls increases...
